
On April 4, 2024, a major storm caused flooding in towns throughout the Cape. In Orleans, near the mouth of Muddy Creek, water from Pleasant Bay surged onto Route 28, shutting down the busy thoroughfare. The impact of such events can now be more easily mitigated by towns thanks to an innovative mapping project developed by geologists at the Center for Coastal Studies.
At 1:00 pm during the storm, the tide gage at the Chatham Fish Pier run by the National Oceanic and Atmospheric Administration (NOAA) read 7.92 ft Mean Lower Low Water (MLLW). At the time water was flowing over a low spot on Route 28 that was mapped by the Center late in 2023 with an elevation at 8.51 feet.
Storm Tide Pathway maps generated by the Center for Coastal Studies pinpointed the precise point where flooding would occur, meaning the level of water that was flooding Route 28 was about a half a foot higher than the tide gauge that was closer to the open ocean. This was very likely due to the easterly winds pushing water in Pleasant Bay to the west, toward route 28 – a phenomenon scientists call “wave setup.”
These Storm Tide Pathways maps, explained Mark Borrelli, Director of the Center’s Seafloor Mapping Program, can allow towns to prepare for flooding, and prevent it if possible.
“That’s how towns start to mobilize resources,” he explained.
The Storm Tide Pathways mapping project began in 2014, when Borrelli and Steve Mague, Director of the Center’s Applied Sciences Program, began looking at coastal maps generated with LIDAR data.
LIDAR stands for light detection and ranging data. The LIDAR maps provided coarse indications of where flooding occur when sea levels rise or storms inundate low-lying areas, but without detail. The maps don’t indicate the specific paths that flooding takes.
Looking at the LIDAR maps, Borrelli and Mague asked each other, “why not make maps that do this street by street instead of state by state?”
So Borrelli and Mague took the maps generated with LIDAR data and overlayed detailed aerial photos to create three-dimensional maps that reveal low-lying areas. Then, with the help of Pedro dos Santos, a hydrologist and Assistant Director of the Seafloor Mapping Program, they used GPS to capture low-level coastal elevations, and potential storm tide pathways. So far, they have charted over 1,500 storm tide pathways on the Cape since 2016, and over 100 in Pleasant Bay alone as part of an ongoing project.
“All we’re doing is making maps, we’re not predicting or modeling the next flood event,” explained Borrelli. The modeling is done by the National Weather Service (NWS). With an approaching storm, the NWS uses its models to predict the Total Water Level, which is the height of the water above mean lower low water, or the lower of a day’s two low tides. The predicted Total Water Level is then viewed within the Storm Tide Pathways map and the flooding extent for the predicted water level becomes apparent.
Since developing their mapping system, Borrelli and his colleagues have mapped all of the Cape Cod Bay shoreline from Provincetown to the Cape Cod Canal, The Nantucket Sound shoreline from Chatham to Barnstable, all of Nantucket and the Vineyard as well as Scituate, and Cohasset. They are now focusing on Pleasant Bay.
Storm tide pathways are not always where you would expect to find them. Flooding water often follows unexpected paths.
In Oak Bluffs on the Vineyard, existing flood maps showed how rising waters would cause major road flooding which appeared to come directly from the Sound. But the detailed Storm Tide Pathways maps revealed something else. The flood waters came from the opposite direction, through a storm drain that passed under the road and this is pretty common says Borrelli. The example illustrates how detailed maps like Storm Tide Pathways maps can allow civil engineers to better understand flood waters and implement cost-effective measures to prevent flooding.
The Town of Eastham is in the process of developing a system to use the maps to warn residents of flood waters, and advise them of the best evacuation route through reverse 911 calls.
“In flat areas, a little sea level rise can do a lot of damage. When water levels reach certain points, there will be flooding, in fact, just six inches more of water during a storm can flood large areas so it’s important to understand and address it,” said Borrelli.
Image above: A Storm Tide Pathways map showing flooding routes in Provincetown.
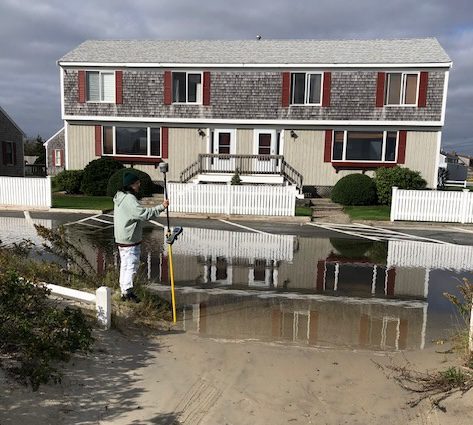 Samantha Jo McFarland, Assistant Director of the CCS Coastal Geographic Research and Applied Science Program, surveys flooding for the Storm Tide Pathways Project in South Yarmouth in 2021.