Storm Tide Pathways
CLICK HERE TO VISIT THE NEW WEB APP, STORMTIDES.ORG
In 2014-2015 Mark Borrelli and Steve Mague at the Center for Coastal Studies developed an idea to map the paths flowing water would take in low-lying coastal areas, called Storm Tide Pathways. At the time many online data portals and websites showed the extent of flooding for a given water level, but these studies are often conducted over large areas and lack the detail needed to act on the local level.
A pair of studies mapping storm tide pathways in Provincetown and Nantucket we were released in June of 2016 that were funded by the Massachusetts Office of Coastal Zone Management. These studies were developed for the people who worked in cities and towns including first responders, DPW staff and other town staff who needed to know where and when the storm waters might be flowing on a street by street basis.
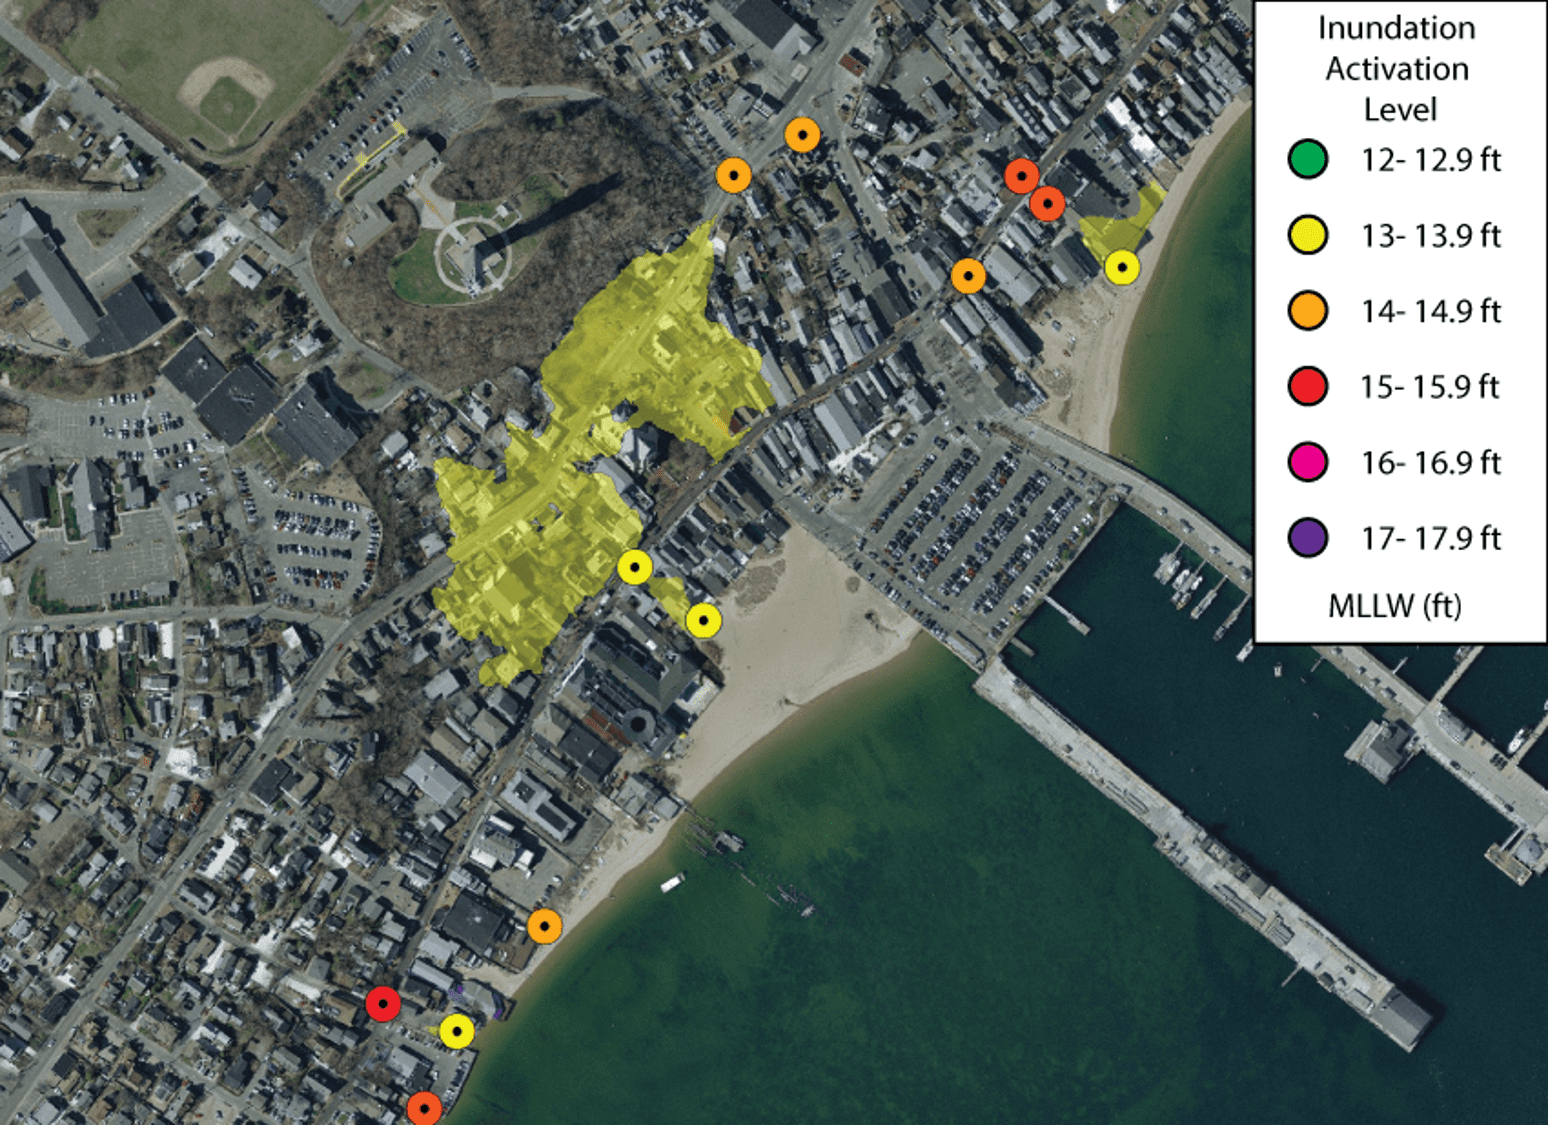
Downtown Provincetown, Massachusetts. Screenshot from digital maps of storm tide pathways.
In 2017, a study was released mapping the Storm Tide Pathways in Truro with our partners at the Boston Office of the National Weather Service (NWS). The storm tide pathways for Provincetown and Truro were posted on the NWS’s coastal inundation website that predicts real time flooding or ‘total water level’ for many areas around Southern New England including Provincetown.

Sceenshot of National Weather Services’s real-time coastal fooding website.
On January 4th, 2018 southern New England experienced a major storm event. This powerful storm created a very high storm surge, which peaked precisely at high tide during an above average spring tide. The Blizzard of 2018 is now the new storm of record for most of the region with water levels exceeding the previous storm of record, the Blizzard of 1978. In Provincetown several of the storm tide pathways mapped in 2016 saw water flowing over them.
The Blizzard of 2018 reminded people that hadn’t seen waters this high since 1978, or didn’t witness them back then, that low-lying coastal areas are at risk. This risk is even greater within a regime of climate change and sea level rise. With projections for sea level rise between 2-8 ft by 2100, steps should be taken now to mitigate these rising waters. The mapping of storm tide pathways is one method that can help predict where waters may flow during the next storm, but can also be used to plan ahead for sea level rise. One of the highest risk areas are low-lying coasts. Look at what just six inches of ‘sea level rise’ can do to this Provincetown neighborhood.
Images taken from NWS website showing a 6 inch change in water level in the ‘West End’ of Provincetown.
Lastly, it is interesting to note that in Provincetown the difference between the peak total water level during the Blizzard of 1978 (15.1 ft) and Blizzard of 2018 (15.5 ft) is about 5 inches. Over those 40 years sea level has risen by about that much. Climate change is having a measurable impact on our coasts right now.


Our Work
Humpback Whale Research
Right Whale Research
Marine Animal Entanglement Response
Marine Geology Department
Water Quality Monitoring Program
Marine Fisheries Research
Seal Research
Shark Research
Marine Education
Interdisciplinary
Marine Debris and Plastics Program
Marine Policy Initiative
Cape Cod Climate Change Collaborative
Publications